Fichier:Ensemble quantum 1DOF canonical.png

Fichier d’origine (900 × 900 pixels, taille du fichier : 78 kio, type MIME : image/png)
Ce fichier et sa description proviennent de Wikimedia Commons.
Description
| DescriptionEnsemble quantum 1DOF canonical.png |
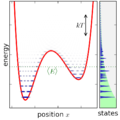
English: Ensemble canonically distributed over energy, for a quantum system consisting of one particle in a potential well. |
| Date | |
| Source | Travail personnel |
| Auteur | Nanite |
Source
Python source code. Requires matplotlib.
from pylab import *

figformat = '.png'
saveopts = {'dpi':300} #, 'bbox_inches':'tight', 'transparent':True, 'frameon':True}
seterr(divide='ignore')

# Very important number, smaller means more classical (finer-spaced discrete levels, larger means more quantum (fewer discrete levels)
hbar = 0.7/(2*pi)

temp_canonical = 4.1
energy_microcanonical = -2.0
range_microcanonical = 1.0
micro_e0 = energy_microcanonical - 0.5*range_microcanonical
micro_e1 = energy_microcanonical + 0.5*range_microcanonical
def potential(x):
    return x**6 + 4*x**3 - 5*x**2 - 4*x
x = linspace(-2.5,2.5,1001)
dx = x[1] - x[0]
U = potential(x)
mass = 1.0

# compute pixel edges, used for pcolormesh.
xcorners = zeros(len(x)+1)
xcorners[:len(x)] = x-0.5*dx
xcorners[-1] = x[-1] + 0.5*dx

# make an energy range, for plots vs energy.
E = linspace(-20,20,10001)

#define color map that is transparent for low values, and dark blue for high values.
# weighted to show low probabilities well
cdic = {'red':   [(0,0,0),(1,0,0)],
        'green': [(0,0,0),(1,0,0)],
        'blue':  [(0,0.7,0.7),(1,0.7,0.7)],
        'alpha': [(0,0,0),
                  (0.1,0.4,0.4),
                  (0.2,0.6,0.6),
                  (0.4,0.8,0.8),
                  (0.6,0.9,0.9),
                  (1,1,1)]}
cm_prob = matplotlib.colors.LinearSegmentedColormap('prob',cdic)

# To get eigenvalues, we need to set up a NxN matrix for the
# Schrodinger equation Hamiltonian. For the momentum operator
# (-hbar^2/(2*m) * d^2/dx^2) the typical central difference
# approximation will be used.
H = zeros((len(x),len(x)))
# set diagonal
H.ravel()[0::len(x)+1] = hbar*hbar/(mass*dx*dx)
H.ravel()[0::len(x)+1] += U
# set above and below diagonal
H.ravel()[1::len(x)+1] = -0.5*hbar*hbar/(mass*dx*dx)
H.ravel()[len(x)::len(x)+1] = -0.5*hbar*hbar/(mass*dx*dx)

# Right, the hamiltonian is set up, so let's just go ahead and
# diagonalize it, poink.
eigval, eigvec = eigh(H)

def doev(H, Emax):
    lowE_idx = find(eigval<Emax)
    figure()
    for i in lowE_idx:
        plot(x,eigvec[:,i], label='E = '+str(eigval[i]))
    legend(fontsize=8)

micro = ((eigval > micro_e0)*(eigval < micro_e1))*1.0
print "microcanonical (E0 =",energy_microcanonical,", Delta =",0.5*range_microcanonical,") avg energy",
print sum(eigval*micro)/sum(micro)

canonical = exp(-eigval/temp_canonical)
canonical_avgE = sum(eigval*canonical)/sum(canonical)
print "canonical (T =",temp_canonical,") avg energy",
print canonical_avgE

# Boring level plot
fig = figure()
ax = axes()
plot(x,potential(x), linewidth=3)
for i in find(eigval<=13):
    axhline(eigval[i], color=(0.5,0.5,0.5),linewidth=0.5,zorder=-1)
ylim(-8,9)
xlim(-2.1,1.7)
fig.get_axes()[0].xaxis.set_ticks([-2,-1,0,1])
xlabel("position $x$")
ylabel("potential $U(x)$")
fig.set_size_inches(3,3)
fig.patch.set_alpha(0)
savefig("quant_potential_eigval_lines"+figformat, **saveopts)

def levelplot(weights):
    """
    Plot the potential with eigenstates' wavefunctions superimposed (shown).
      weights: list fractions to multiply each eigenstate probability
               (e.g., weight 0: do not show. weight 1: fully show)
      name: filename to save to
    """

    fig = figure()
    ax = axes([0.08,0.1,0.73,0.89]) #([0.125,0.1,0.71,0.8])
    plot(x,potential(x), linewidth=2, color='r', zorder=-1)
    maxp = dx*3.5*amax(weights)
    eigwidth = 0.2
    for i in find(eigval<=9):
        # Here, we plot the eigenfunctions as horizontal bars of varying darkness,
        # with height set by the energy eigenvalue.
        if weights[i] == 0: continue # don't plot levels with zero weight
        pdist = eigvec[:,i]**2 * weights[i]
        pdist.shape = (1,len(x))
        extent = (amin(x)-0.5*dx, amax(x)+0.5*dx, eigval[i]-0.5*eigwidth, eigval[i]+0.5*eigwidth)
        img = imshow(vstack((pdist,pdist)), cmap=cm_prob, extent=extent, interpolation='none', aspect='auto')
#        Alternate code using pcolormesh doesn't work because of ugly edges.
#        ycorners = vstack([
#            [eigval[i]-0.5*eigwidth]*(len(x)+1),
#            [eigval[i]+0.5*eigwidth]*(len(x)+1) ])
#        pcolormesh(vstack([xcorners,xcorners]), ycorners, pdist, cmap=cm_prob)
        clim(0,maxp)

    ylim(-9,9)
    xlim(-2.1,1.7)
    fig.get_axes()[0].xaxis.set_ticks([-2,-1,0,1])
    ax.xaxis.set_ticklabels([])
    ax.yaxis.set_ticklabels([])
    ax.xaxis.labelpad = 2
    ax.yaxis.labelpad = -3
    xlabel("position $x$")
    ylabel("energy")

    ax = axes([0.83,0.1,0.14,0.89], axisbg=(0.95,0.95,0.95))
    ax.xaxis.set_ticks([])
    ax.yaxis.set_ticklabels([])
    ax.yaxis.set_ticks_position('right')
    ylim(-9,9)
    xlabel("states")
    dos = E*0.0
    for i,Elevel in enumerate(eigval):
        # Here we sum up the density of states function
        if Elevel > 20: continue # don't waste time with high levels
        dos += exp(-4*((E-Elevel)/eigwidth)**2) * weights[i]
    fill_betweenx(E, dos, linewidth=0, color=(0.2,0.2,0.76))
    xlim(-0.05*max(dos),max(dos)*1.1)

    fig.set_size_inches(3,3)
    fig.patch.set_alpha(0)

levelplot(ones(len(eigval)))
savefig("quant_potential_eigval_pdists"+figformat, **saveopts)

levelplot(micro)
sca(gcf().axes[0])
axhspan(micro_e0, micro_e1, color=(0.7,1,0.7),zorder=-2)
sca(gcf().axes[1])
axhspan(micro_e0, micro_e1, color=(0.7,1,0.7),zorder=-2)
savefig("quant_potential_eigval_pdists_micro"+figformat, **saveopts)

levelplot(canonical)
sca(gcf().axes[0])
annotate("$\\langle E\\rangle$", (-0.5,canonical_avgE),
    textcoords=None,verticalalignment='top',color=(0,0.4,0))
axhline(canonical_avgE, linestyle='dotted', linewidth=1,color=(0,0.4,0))
annotate('',(1.2,7.-temp_canonical),(1.2,7.),
    arrowprops = {'arrowstyle':'<->'})
text(1.15,7.-0.5*temp_canonical,'$kT$',
    horizontalalignment='right',verticalalignment='center')
sca(gcf().axes[1])
axhline(canonical_avgE, linestyle='dotted', linewidth=1,color=(0,0.4,0))
fill_betweenx(E, exp(-E/temp_canonical), linewidth=0, color=(0.7,1,0.7),zorder=-2) # green exponential
savefig("quant_potential_eigval_pdists_canonical"+figformat, **saveopts)

# Position expectation values
figure()
pdist = zeros(len(x))
for i,p in enumerate(micro): pdist += p*eigvec[:,i]**2
if any(micro):
    plot(x, pdist/sum(micro)/dx, label='microcanonical')
pdist = zeros(len(x))
for i,p in enumerate(canonical): pdist += p*eigvec[:,i]**2
plot(x, pdist/sum(canonical)/dx, label='canonical', color='g')
xlim(-2.1,1.7)
fig.get_axes()[0].xaxis.set_ticks([-2,-1,0,1])
xlabel("position $x$")
ylabel("PDF of position $P(x)$")
legend()
savefig("quant_position_pdf"+figformat, **saveopts)
Conditions d’utilisation
| Ce fichier est disponible selon les termes de la licence Creative Commons CC0 Don universel au domaine public. | |
| La personne qui a associé une œuvre avec cet acte l’a placée dans le domaine public en renonçant mondialement à tous ses droits sur cette œuvre en vertu des lois relatives au droit d’auteur, ainsi qu’à tous les droits juridiques connexes et voisins qu’elle possédait sur l’œuvre, sans autre limite que celles imposées par la loi. Vous pouvez copier, modifier, distribuer et utiliser cette œuvre, y compris à des fins commerciales, sans qu’il soit nécessaire d’en demander la permission.
http://creativecommons.org/publicdomain/zero/1.0/deed.enCC0Creative Commons Zero, Public Domain Dedicationfalsefalse |
Légendes
Éléments décrits dans ce fichier
dépeint
Valeur sans élément de Wikidata
30 octobre 2013
Historique du fichier
Cliquer sur une date et heure pour voir le fichier tel qu'il était à ce moment-là.
| Date et heure | Vignette | Dimensions | Utilisateur | Commentaire | |
|---|---|---|---|---|---|
| actuel | 30 octobre 2013 à 23:51 |  | 900 × 900 (78 kio) | Nanite | User created page with UploadWizard |
Utilisation du fichier
La page suivante utilise ce fichier :
Usage global du fichier
Les autres wikis suivants utilisent ce fichier :
- Utilisation sur en.wikipedia.org
- Utilisation sur fa.wikipedia.org
Métadonnées
Ce fichier contient des informations supplémentaires, probablement ajoutées par l'appareil photo numérique ou le numériseur utilisé pour le créer.
Si le fichier a été modifié depuis son état original, certains détails peuvent ne pas refléter entièrement l'image modifiée.
| Résolution horizontale | 118,11 pt/cm |
|---|---|
| Résolution verticale | 118,11 pt/cm |
