
Fichier:Satellite Temperatures.png

Taille de cet aperçu : 800 × 530 pixels. Autres résolutions : 320 × 212 pixels | 640 × 424 pixels | 1 024 × 678 pixels | 1 280 × 848 pixels | 2 400 × 1 590 pixels.
Fichier d’origine (2 400 × 1 590 pixels, taille du fichier : 297 kio, type MIME : image/png)
Ce fichier et sa description proviennent de Wikimedia Commons.
| Description |
 
|
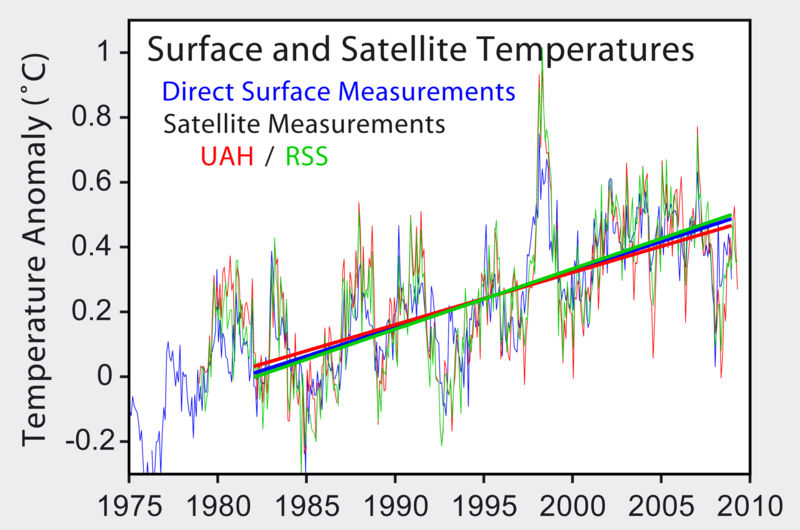
| Source | http://www.cru.uea.ac.uk/cru/data/temperature/ |
| Auteur | Robert A. Rohde |
Description ==
Image from Global Warming Art
This image is an original work created for Global Warming Art. Please refer to the image description page for more information.

|
Vous avez la permission de copier, distribuer et modifier ce document selon les termes de la GNU Free Documentation License version 1.2 ou toute version ultérieure publiée par la Free Software Foundation, sans sections inaltérables, sans texte de première page de couverture et sans texte de dernière page de couverture. Un exemplaire de la licence est inclus dans la section intitulée GNU Free Documentation License. |
| Ce fichier est disponible selon les termes de la licence Creative Commons Attribution – Partage dans les Mêmes Conditions 3.0 (non transposée). | ||
| ||
| Ce bandeau de licence a été ajouté à ce fichier dans le cadre de la procédure de mise à jour des licences des images sous GFDL. |
Historique du fichier
Cliquer sur une date et heure pour voir le fichier tel qu'il était à ce moment-là.
| Date et heure | Vignette | Dimensions | Utilisateur | Commentaire | |
|---|---|---|---|---|---|
| actuel | 31 juillet 2009 à 22:30 | | 2 400 × 1 590 (297 kio) | Dragons flight | update |
| 10 avril 2006 à 09:10 |  | 512 × 363 (30 kio) | Pflatau |
Utilisation du fichier
Les 2 pages suivantes utilisent ce fichier :
Usage global du fichier
Les autres wikis suivants utilisent ce fichier :
- Utilisation sur ca.wikipedia.org
- Utilisation sur de.wikipedia.org
- Utilisation sur en.wikipedia.org
- Satellite temperature measurement
- Leipzig Declaration
- User:Dragons flight/Images
- Temperature measurement
- User:C-randles
- Friends of Science
- Talk:Friends of Science
- User:Debnigo
- User:Merlinme/Sandbox
- Microwave Sounding Unit temperature measurements
- Wikipedia:Reference desk/Archives/Science/2011 June 13
- User talk:Sailsbystars/Archive 2
- Utilisation sur es.wikipedia.org
- Utilisation sur fa.wikipedia.org
- Utilisation sur ko.wikipedia.org
- Utilisation sur pl.wikipedia.org
- Utilisation sur pt.wikipedia.org