
Fichier:Hurricane statistics.png

Taille de cet aperçu : 800 × 526 pixels. Autres résolutions : 320 × 210 pixels | 640 × 421 pixels | 831 × 546 pixels.
Fichier d’origine (831 × 546 pixels, taille du fichier : 31 kio, type MIME : image/png)
Ce fichier et sa description proviennent de Wikimedia Commons.
Description
| Description |
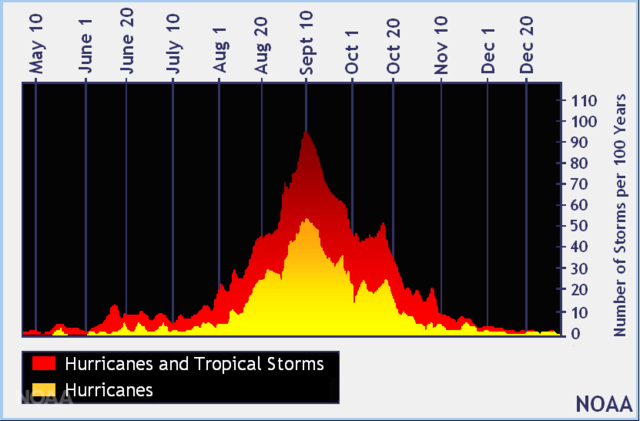
English: This graphic shows the temporal distribution of tropical cyclones in the North Atlantic bassin. The number of tropical storm and hurricane days this basin (the Atlantic Ocean, the Caribbean Sea, and the Gulf of Mexico) jumps markedly by mid-August. |
| Date | |
| Source | http://www.noaa.gov/stories/peak-of-hurricane-season-why-now |
| Auteur | National Hurricane Center of the NOAA |
Conditions d’utilisation
Cette image est dans le domaine public car son contenu provient de la
National Oceanic and Atmospheric Administration , réalisé par un employé dans le cadre de ses activités professionnelles.
|
Historique du fichier
Cliquer sur une date et heure pour voir le fichier tel qu'il était à ce moment-là.
| Date et heure | Vignette | Dimensions | Utilisateur | Commentaire | |
|---|---|---|---|---|---|
| actuel | 3 septembre 2016 à 19:19 | | 831 × 546 (31 kio) | Pierre cb | {{Information |Description ={{en|1=This graphic shows the temporal distribution of tropical cyclones in the North Atlantic bassin. The number of tropical storm and hurricane days this basin (the Atlantic Ocean, the Caribbean Sea, and the Gulf of Mex... |
Utilisation du fichier
La page suivante utilise ce fichier :